

Sodium Cyanide Price Rises 5% in Q1 2026 | Global Forecast & Trends
Global pricing in early 2026 reflected a firm yet uneven trend, with the Sodium Cyanide Price supported by strong demand from gold mining and metallurgical applications. The Sodium Cyanide Price Chart showed a ~5.2% increase compared to Q4 2025, mainly due to rising production costs and steady industrial consumption. Prices varied significantly across regions, with North America recording the highest levels, while Southeast Asia remained more cost-competitive.
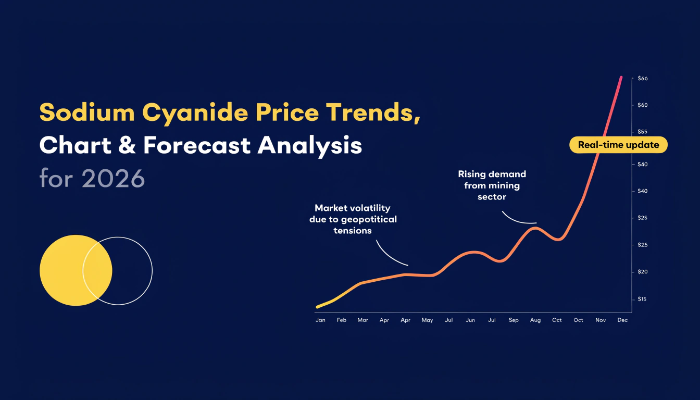
Sodium Cyanide Price Chart Analysis Q1 2026 (Monthly Trends & Key Highlights)
The Sodium Cyanide Price Chart for Q1 2026 indicates a gradual upward trend with slight fluctuations across the quarter. January prices were stable, followed by a noticeable rise in February due to increased mining activity. March saw peak pricing as supply tightened in key regions.
- Highest price: USA at USD 3248/MT
- Lowest price: Indonesia at USD 1734/MT
- Quarter trend: Consistent upward movement with mild volatility
Compared to Q4 2025, when prices were relatively softer due to lower seasonal demand, Q1 2026 demonstrates a clear recovery pattern. The overall chart movement remained predictable, helping buyers manage procurement more efficiently.
Sodium Cyanide Price Trend Q1 2026 (Global Market Direction Explained)
Across global markets, the sodium cyanide price trend remained strong and slightly bullish. Demand from gold extraction industries played a major role in maintaining price stability. Additionally, higher input costs, including energy and raw materials, contributed to the upward pressure.
Supply remained controlled due to strict regulations and limited production expansions, especially in developed regions. This balance between demand and supply kept prices stable with gradual growth.
Regional Price Analysis (Demand & Supply Insights by Region)
North America Market Trends
In the United States, prices reached USD 3248/MT, the highest among all regions. Strong demand from mining operations and higher production costs supported elevated pricing. Limited domestic supply additions also contributed to firm price levels.
Latin America Pricing Overview
Latin American countries showed moderate pricing trends. Brazil recorded USD 2136/MT, while Argentina stood at USD 2358/MT. Growing mining activities supported demand, while regional production helped maintain stable supply.
Asia-Pacific Market Insights
Asia-Pacific remained the most price-competitive region. Indonesia reported USD 1734/MT, the lowest globally, due to lower production costs and strong local supply. Australia recorded USD 2118/MT, supported by its mining sector demand and stable production environment.
Regional Price Snapshot: Sodium Cyanide Prices Outlook Q1 2026
- USA: USD 3248/MT
- Indonesia: USD 1734/MT
- Australia: USD 2118/MT
- Brazil: USD 2136/MT
- Argentina: USD 2358/MT
This snapshot highlights clear regional price differences driven by production costs, demand intensity, and supply availability. North America leads with the highest prices due to strong industrial demand and cost structures. Asia-Pacific offers the lowest pricing due to efficient production, while Latin America maintains balanced pricing supported by growing mining activities and regional supply stability.
Key Factors Driving Sodium Cyanide Prices
- Strong demand from gold mining and extraction industries
- Rising energy and raw material costs
- Limited global production capacity expansion
- Strict environmental and safety regulations
- Stable demand from metallurgical applications
Sodium Cyanide Price Forecast 2026 (Future Outlook & Expectations)
The Sodium Cyanide Price Forecast for 2026 suggests a steady upward trend with moderate growth potential. Demand from mining sectors is expected to remain strong, particularly in emerging economies.
Prices may increase by 3% to 6% during the year, depending on global mining output and regulatory developments. However, stable supply from key producers may help prevent extreme price volatility, ensuring a balanced outlook.
Sodium Cyanide Price Index & Historical Comparison (Long-Term Insights)
The Sodium Cyanide Price Index provides a benchmark for tracking pricing changes over time. In Q1 2026, the index showed a notable rise compared to early 2025, reflecting improved demand conditions.
Looking at the sodium cyanide price history chart, prices have experienced gradual increases over the past few years, mainly due to rising demand from mining industries and tighter regulatory controls. Compared to historical averages, current prices remain on the higher side, indicating sustained demand strength.
Impact on Related Industries (Downstream Market Effects)
Changes in sodium cyanide pricing are affecting several related sectors:
- Gold mining companies facing increased operational costs
- Metallurgical industries adjusting procurement strategies
- Chemical manufacturers managing higher input expenses
- Precious metal refining sectors adapting to price shifts
These industries may pass on increased costs or optimize operations to maintain profitability.
Stay Ahead with Latest Price Trends – Grab Your Sample Today: https://www.imarcgroup.com/sodium-cyanide-price-trend/requestsample
FAQs About Sodium Cyanide Pricing Insights for 2026 & Trend Analysis:
What does the Sodium Cyanide Price Chart indicate for Q1 2026?
The Sodium Cyanide Price Chart shows a steady upward trend with moderate monthly increases, supported by strong demand from mining industries.
How is the Sodium Cyanide Price Index useful?
The Sodium Cyanide Price Index helps track pricing trends over time, allowing businesses to compare current prices with historical data for better planning.
What is the Sodium Cyanide price forecast 2026?
The sodium cyanide price forecast 2026 indicates a stable rise of around 3%–6%, driven by continued demand from gold mining and industrial applications.
Conclusion: Sodium Cyanide Price Outlook Moving Forward
Q1 2026 reflects a firm and gradually rising pricing environment, supported by strong mining demand and controlled supply. Regional differences remain significant, with North America leading in pricing and Asia-Pacific offering cost advantages. The overall outlook suggests stable growth with limited volatility. Going forward, mining activity and regulatory factors will play a key role in shaping price trends throughout 2026.
Contact Us:
IMARC Group
134 N 4th St., Brooklyn, NY 11249, USA
Email: sales[@]imarcgroup.com
Tel No:(D) +91 120 433 0800
United States: +1-201971-6302